
What is Production Possibility Curve?
The Production Possibility Curve is a graphical model that helps manufacturers plan the production of ideal units of goods in a given scenario so that they can meet the maximum resource utilization and reduce wastage and production costs.
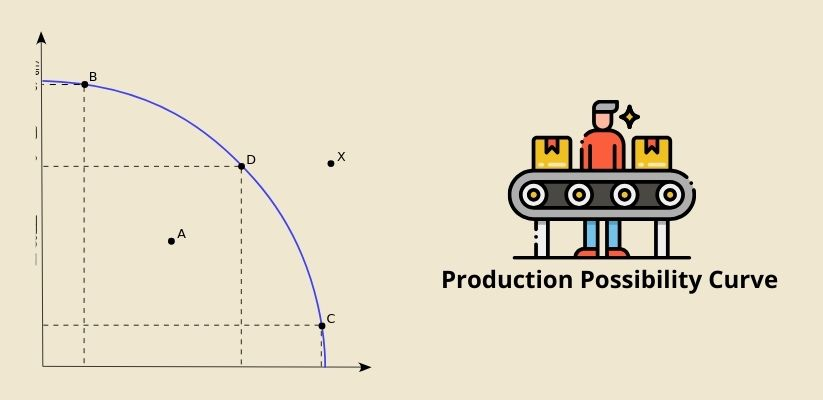
The Production Possibility Curve is an interesting concept that helps manufacturers evaluate scarcity and opportunity costs while planning the production of two goods or services simultaneously. In an ideal scenario, points on the interior depict inefficiency, points on the PPC depict efficiency, whereas points beyond the PPC are indicative of inefficiency.
Different Types of Production Possibility Curve
As we’ve discussed the production possibility curve meaning, let us now go through some of the types of PPC:
1. Concave PPF
- Increasing Opportunity Costs: Reflects the concept that as the production of one good rises, the opportunity cost of producing the other rises disproportionately.
- Non-Adaptable Resources: Implies that resources are not easily transferable between the production of different goods.
- Limited Efficiency: Indicates that resources are specialized and not efficiently allocated between the two goods.
- Real-world Examples: Commonly observed in economies where resources have specific applications and are not easily interchangeable.
2. Straight-line PPF
- Constant Opportunity Costs: Demonstrates that the opportunity cost of producing one good remains the same, regardless of the level of production of the other good.
- Highly Adaptable Resources: Implies that resources can be easily shifted between the production of different goods.
- Efficient Resource Allocation: Suggests that resources are versatile and can be allocated optimally for different production levels.
- Linear Trade-offs: Shows a consistent trade-off between the two goods without any variation.
3. Convex PPF
- Decreasing Opportunity Costs: Reflects the idea that as the production of one good rises, the opportunity cost of producing the other decreases.
- Resource Adaptability: Indicates that resources are well-suited to alternative uses and can be easily transferred.
- Efficient Resource Allocation: Implies optimal distribution of resources leading to efficient production.
- Specialization Benefits: Supports the notion that specialization in production enhances overall efficiency.
4. Bowed-outward PPF
- Increasing Returns to Scale: Suggests that as production increases, the efficiency of resource utilization improves.
- Resource Specialization: Resources become more efficient as they specialize in the production of a particular good.
- Economies of Scale: Reflects the concept that larger quantities of production result in lower average costs.
- Dynamic Efficiency: Indicates a dynamic and adaptive economy with improving efficiency over time.
What are the Components of the Production Possibility Curve?
Now that we’re familiar with the concept of PPC, we’ll explain production possibility curve components in detail.
1. Two Axes
The PPC is typically depicted on a graph with two axes representing the two goods or services being compared. In the context of production possibility curve examples, the x-axis on a simple PPC might represent the quantity of Good X, while the y-axis represents the quantity of Good Y.
2. Attainable and Unattainable Points
The curve shows all the possible combinations of the two goods that can be produced using the available resources. Points on the curve represent attainable combinations, while points inside the curve are feasible but not efficient, and points outside the curve are unattainable given the current level of resources.
3. Opportunity Cost
The slope of the PPC represents the opportunity cost of producing one good in terms of the other. As an economy moves along the curve, reallocating resources from one good to another, the opportunity cost changes.
4. PPC Curve Shifts
Changes in resource availability, technology, or efficiency improvements can lead to shifts in the entire PPC. For instance, an increase in the labor force or technological advancements might shift the curve outward, indicating an increase in the overall production capacity of the economy.
5. Comparative Advantage
The PPC highlights the concept of comparative advantage, where a country or individual specializes in producing the good with a lower opportunity cost. This principle guides international trade and cooperation among individuals and nations.
6. Dynamic Nature
The PPC changes over time due to factors like technological advancements, shifts in resources, and economic growth. As an economy evolves, the PPC can shift outward, reflecting increased production possibilities, or inward during periods of economic decline. This dynamic nature highlights the ever-changing nature of economies and the need to consider temporal factors in economic analysis.
What are the Factors Affecting Production Possibility Curve?
Several factors can affect the position, shape, and movement of the Production Possibilities Curve (PPC):
1. Resource Availability
The quantity and quality of available resources, such as labor, capital, and natural resources, significantly impact the production possibility frontier. An increase in available resources can shift the PPC outward, expanding the production possibilities for both goods.
2. Technological Advancements
Improvements in technology can increase productivity and efficiency in the production process. Technological advancements often result in an outward shift of the production possibility frontier, allowing for the production of more goods and services with the same amount of resources.
3. Capital Investments
Increased investments in capital goods, such as machinery and technology, can enhance the productive capacity of an economy. This leads to an outward shift of the production possibility frontier, reflecting the ability to produce more goods and services.
4. International Trade
Engaging in international trade and specialization can affect the PPC. By focusing on producing goods in which they have a comparative advantage, countries can achieve higher levels of efficiency and expand their production possibilities.
5. Government Policies
Government policies, such as taxes, subsidies, and regulations, can influence resource allocation and production efficiency. Well-designed policies can positively impact the production possibility frontier, while inefficient policies may hinder economic growth.
6. Changes in Productivity
Productivity gains, which can result from better training, education, or organizational improvements, affect the efficiency of resource utilization. Higher productivity can lead to an outward shift in the Production Possibility Frontier.
What are the Applications of the Production Possibility Curve?
Now that we’ve discussed everything including the concept of production possibility curve, let us discuss the key applications of the production possibility curve include:
1. Resource Allocation
The production possibility frontier illustrates the trade-offs a society faces when allocating its scarce resources between the production of different goods and services. It helps decision-makers understand the opportunity cost of choosing one combination of goods over another.
2. Efficiency Analysis
The production possibility frontier serves as a benchmark for assessing the efficiency of resource utilization. The points on the curve indicate the effective use of resources, the ones inside the curve indicate underutilization and the ones outside the curve are beyond reach given the current state of resources.
3. Economic Growth
Changes in the position of the PPC over time reflect economic growth. An outward shift of the curve indicates an increase in the economy’s capacity to produce goods and services, often resulting from factors like technological advancements, increased resources, or improved productivity.
4. Comparative Advantage
The PPC is instrumental in explaining the concept of comparative advantage. By comparing opportunity costs at different points on the curve, individuals or countries can identify where they have a comparative advantage in production, leading to more efficient specialization and trade.
5. Trade Analysis
The PPC is closely related to international trade. Countries can specialize in producing goods where they have a comparative advantage and trade with other nations to obtain goods they cannot efficiently produce. The PPC helps visualize the benefits of trade in terms of expanded production possibilities.
6. Consumer Choice
The PPC can be extended to analyze consumer choices by incorporating indifference curves. This helps in understanding how consumers allocate their budgets among different goods to maximize utility, considering their preferences and budget constraints.
What are the Limitations of the Production Possibility Curve?
There are innumerable production possibility curve uses such as its usability for understanding economic concepts. However, it is not free from limitations. Here are some of its major limitations:
1. Assumption of Full Employment
The PPC assumes that all resources are fully employed. In reality, there may be situations of unemployment or underutilization of resources, which the PPC does not account for. This assumption can limit the practicality of the model in real-world scenarios.
2. Simplification of Reality
The PPC is a simplified model that assumes a two-dimensional world with only two goods. In reality, economies deal with a multitude of goods and services, making the model less applicable to complex, multi-dimensional economic systems.
3. Static Model
The PPC is a static model that does not account for changes over time. Economic conditions, technology, and resources evolve, but the PPC does not capture these dynamic changes, limiting its ability to predict future production possibilities accurately.
4. Assumption of Fixed Technology
The model assumes a fixed level of technology, neglecting the impact of technological advancements on production possibilities. In reality, technological progress can significantly alter the efficiency and capacity of production.
5. Homogeneous Production Factors
The PPC assumes that all units of a particular resource are identical. In reality, factors of production, such as labor and capital, are diverse, and the model does not account for variations in the quality or skills of these factors.
6. Ignores Cultural Factors
The PPC does not consider the influence of institutional and cultural factors on production possibilities. These factors, such as legal systems, property rights, and cultural attitudes toward work, can play a significant role in shaping an economy.
FAQs
1. What is the Production Possibility Curve Meaning?
To define production possibility curve, it is a model that illustrates a society’s trade-offs in allocating its scarce resources to produce different goods and services. A production possibility curve (PPC) is a graphical representation of the maximum output combinations of two goods that an economy can achieve, given its level of technology and available resources.
2. What are Production Possibility Curve Uses?
A Production possibilities curve serves as a visual and analytical tool that aids economists, policymakers, and students in understanding the fundamental principles of resource allocation, opportunity cost, and economic efficiency.
3. What are Some Production Possibility Curve Examples?
A country faces a trade-off between producing military goods and civilian goods. Other production possibility curve examples include an economy that must choose between allocating resources to education or producing consumer goods, illustrating opportunity costs on the production possibility curve.
4. What Does an Outward Shift in the PPC Indicate?
An outward shift in the production possibility curve (PPC) signifies an increase in a nation’s overall capacity to produce goods and services. This expansion is indicative of economic growth and improved efficiency in resource utilization.
5. Why is Understanding Production Possibility Curve Important?
Understanding the production possibility curve is crucial for policymakers, economists, and businesses to make informed decisions about resource allocation, economic growth, and trade. It provides a visual representation of the fundamental economic concepts related to scarcity, choice, and opportunity cost.
6. What Does an Inefficient Point on the PPC Signify?
An inefficient point on the production possibilities Frontier signifies that the economy is not utilizing its resources effectively or is not operating at full capacity. In the context of the concept of production possibility curve, efficiency means that an economy is using all available resources to produce goods and services in the most effective way possible.