What is Key Performance Indicator (KPI)?
A Key Performance Indicator (KPI) synthesizes raw business data into key metrics used to measure the performance or efficiency of various business activities such as finance, sales, customer support, and production, to achieve common goals.
ERP Software uses a multitude of KPIs to track the leads & conversion ratios, average response time, net profit margin, and return on investments, among others. It is a strategic tool that fosters smart & informed decision-making and lets you fuel growth & success.
Different Types of Key Performance Indicator (KPI)
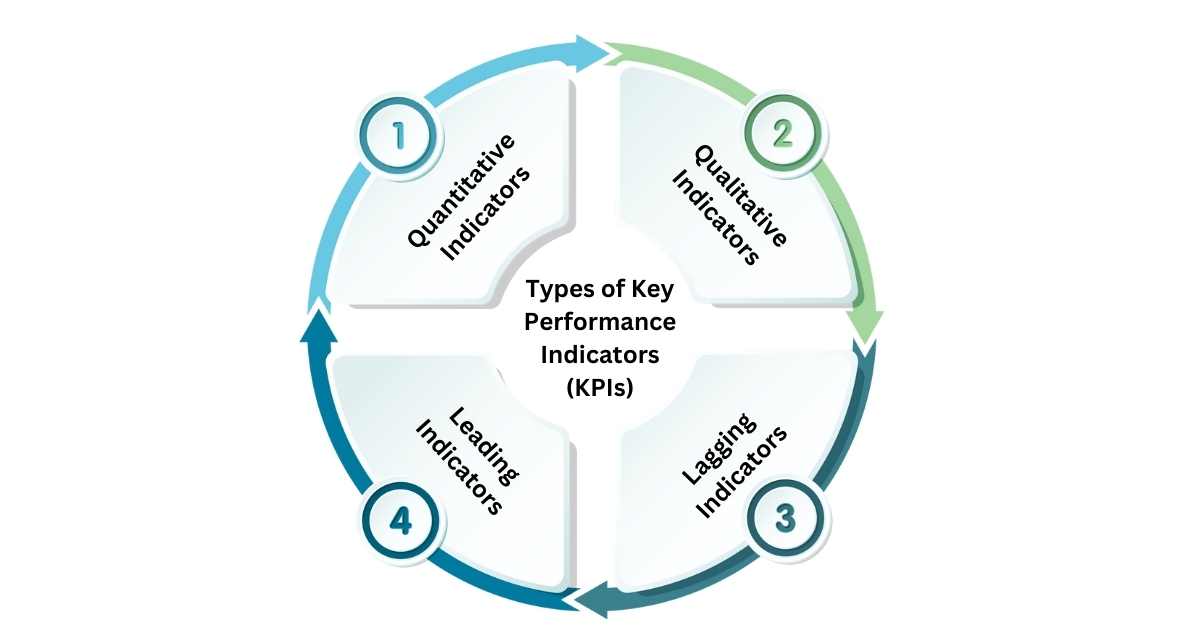
1. Quantitative Indicators
These indicators are based on numerical measures. They provide data-driven numerical results which are typically more accurate than their Qualitative counterparts. For example, tracking sales targets, revenue targets, and leads conversion using a Sales Management System.
2. Qualitative Indicators
Unlike Quantitative Indicators, these indicators are not based on numerical measures. Instead, they are open to multiple interpretations. For example, using an Automotive ERP to track the customer experience of your clients.
3. Lagging Indicators
Lagging Indicators are the indicators that provide analysis of past occurrences for decision-making. For example, pharmaceutical companies may deploy Pharma ERP Software to analyze the past year’s sales and revenue growth.
4. Leading Indicators
Unlike Lagging Indicators, these indicators are futuristic. They allow decision-makers to predict future trends & events and make futuristic decisions. For example, identify revenue opportunities in the next fiscal quarter or year using Financial Management Software.
Examples of KPIs Used Across Different Business Functionaries
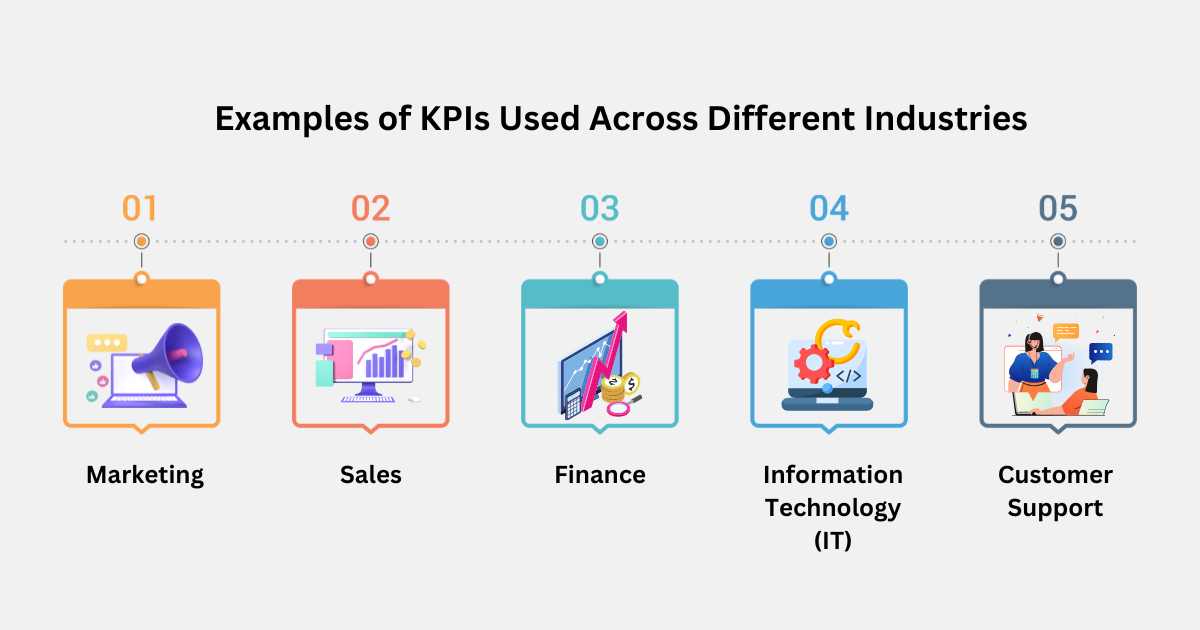
I. Marketing
- Marketing Qualified Leads
- Sales Qualified Leads
- Social Media ROI
- Goal-based Conversion Rates
- Conversion Rates
- Return on Ad Spent
II. Sales
- Sales Volume by Location
- Average Order Value
- New Inbound Leads
- New Qualified Opportunities
- Total Pipeline Value
III. Finance
- Operating Expense Ratio
- Working Capital Ratio
- Gross Profit Margin
- Operating Profit Margin
- New Profit Margin
IV. Information Technology (IT)
- Total Support Tickets
- Open Support Tickets
- Reopened Tickets
- Ticket Resolution Time
- IT Costs vs Revenue
- Security-related Downtimes
V. Customer Support
- Average Response Time
- Cost Per Conversation
- First Contact Resolution Rate
- Most Active Support Agents
- Customer Effort Score
I. Marketing
1. Marketing Qualified Leads (MQLs)
Ascertains the leads that are more likely to convert into customers. Typically achieved using a Lead Management System.
2. Sales Qualified Leads (SQLs)
Ascertains the leads that have been marked by the sales team for meeting its qualification criteria
3. Social Media ROI
Ascertains the monetary value generated through investments in social media campaigns
4. Goal-based Conversion Rates
Ascertain the percentage of users who took the desired action (for example, furniture companies may deploy an ERP for Furniture Manufacturing to track how many users downloaded product brochures)
5. Conversion Rates
Ascertain the percentage of users who completed a conversion to understand the effectiveness of your campaigns and landing pages
6. Return on Ad Spent
Ascertain the performance of various ad campaigns to understand their effectiveness & profitability
II. Sales
1. Sales Volume by Location
Ascertain the locations where the company’s products or services are sold
2. Average Order Value
Ascertain the average amount a customer spends. Understand the consumer’s psychology and demand trends & patterns using powerful Demand Forecasting tools.
3. New Inbound Leads
Ascertain the inbound leads generated over a specific timeframe. It’s an important indicator used during the Lead Generation analysis.
4. New Qualified Opportunities
Ascertain the sales opportunities matching the company’s pre-determined qualifications (such as minimum spending power, requirements, etc.)
5. Total Pipeline Value
Ascertains the total value of the potential revenue that can be generated from your sales pipeline
III. Finance
1. Operating Expense Ratio
Ascertains the cost to operate a property versus the revenue acquired from it.
2. Working Capital Ratio
Ascertains the company’s liquidity by dividing current assets by current liabilities.
3. Gross Profit Margin
Ascertains the company’s percentage revenue retained after subtracting direct labor and direct materials.
4. Operating Profit Margin
Ascertains the percentage profit derived by the company before subtracting taxes and interest charges.
5. Net Profit Margin
Ascertains the percentage profit retained by the company after the deduction of the expenditures.
IV. Information Technology (IT)
1. Total Support Tickets
Ascertain the support requests received over a specific period of time.
2. Open Support Tickets
Ascertain the unresolved tickets over a specific period of time to indicate the effectiveness of the IT Support.
3. Reopened Tickets
Ascertain the number of tickets reopened after they were previously closed. A higher number may indicate inadequate resolution.
4. Ticket Resolution Time
Ascertains the time taken to resolve customer resolutions. It helps understand the efficiency of the IT Support and take appropriate measures.
5. IT Costs vs Revenue
Ascertain the cost-effectiveness of the IT operations by comparing the IT support expenditures against the revenue generated from it.
6. Security-related Downtimes
Ascertain the duration of outages caused by security incidents such as data breaches, DDoS attacks, ransomware attacks, etc.
V. Customer Support
1. Average Response Time
Ascertain the average time taken to respond to consumer’s complaints. A low average response time is typically preferred.
2. Cost Per Conversation
Ascertain the cost incurred for interaction with each customer support executive.
3. First Contact Resolution Rate
Ascertain the percentage of customers whose issues were resolved within the first contact
4. Most Active Support Agents
Ascertain the support agents handling the most customer support requests. Helps identify the top-performing support agents.
5. Customer Effort Score
Ascertain the simplicity of contacting customer support. The lower the better.

How to Generate a KPI Report?
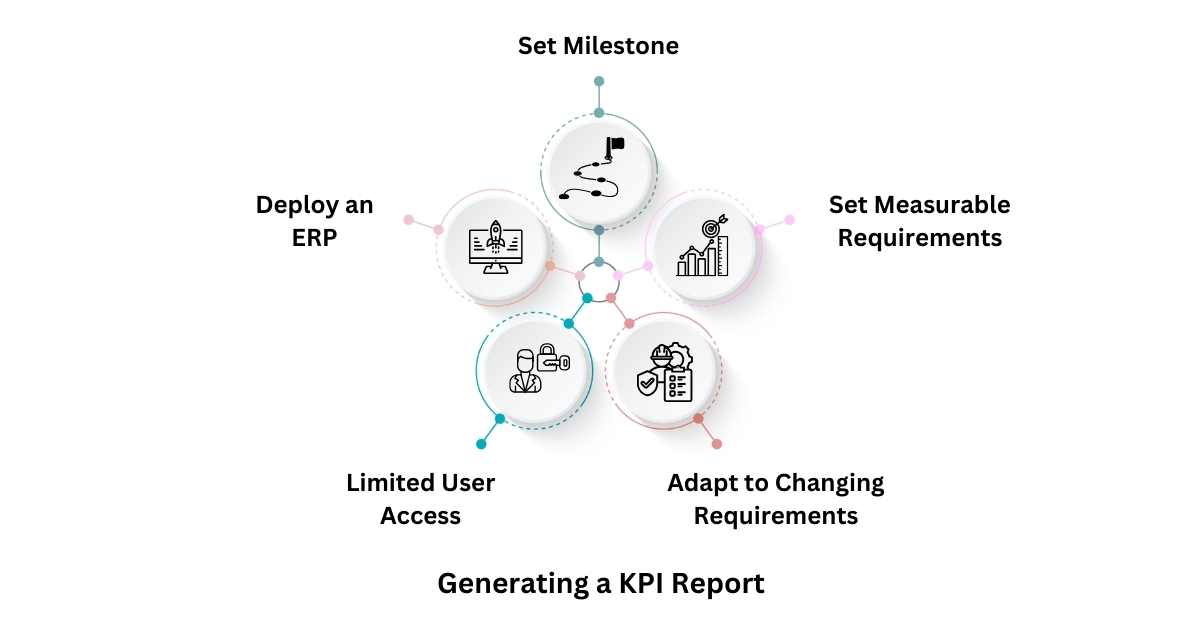
1. Set Milestones
First and foremost, determine your business goals and objectives. For example, you can track whether your sales targets have been met with a Manufacturing ERP.
2. Set Measurable Requirements
Set measurable requirements that are realistic and attainable. Set a specific timeframe to achieve your goals.
3. Adapt to Changing Requirements
Make sure that your KPIs are customizable to meet the evolving market requirements. Avoid KPIs that are too rigid or unchangeable.
4. Limited User Access
Last but not least, ensure only a limited number of users have access to your KPIs. It will help avoid confusion and ensure your staff focuses on only needful KPIs.
5. Deploy an ERP
Best ERP Software in India provides you with a 360-degree overview of your company’s operational performance and financial health.
What are the Qualities of a Good Key Performance Indicator (KPI)
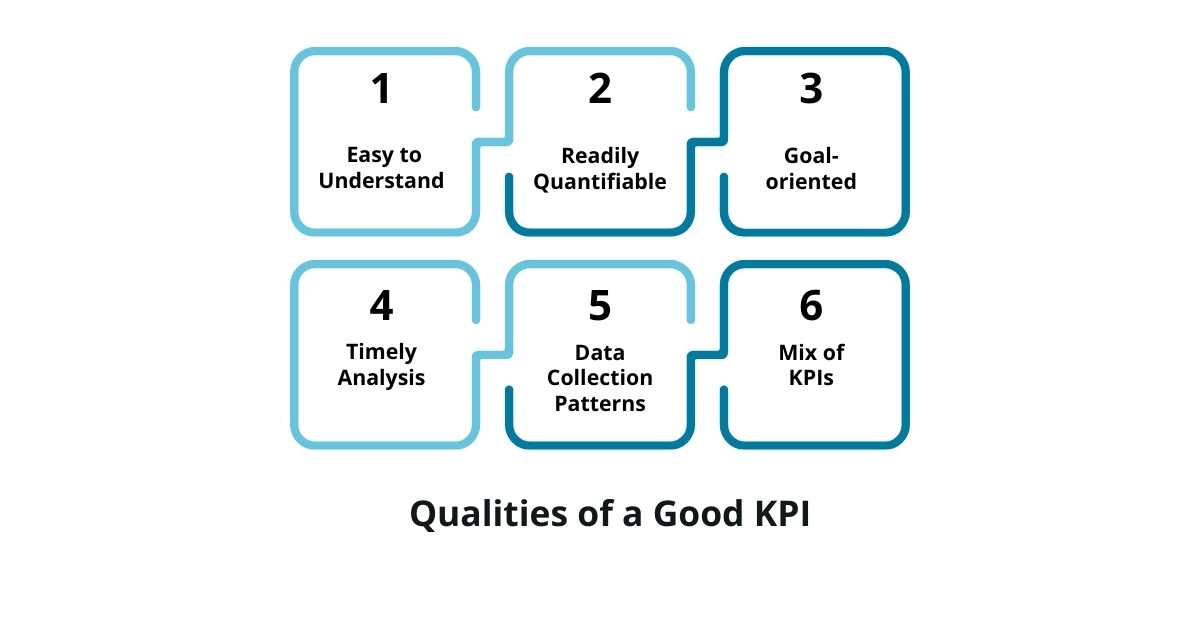
1. Easy to Understand
Keep your KPI simple and easy to understand. This will make it easier for you to understand the impact of your business decisions on it, and fine-tune your business policies.
2. Readily Quantifiable
Make sure that your KPIs are easily measurable. Use different methods to periodically track their performance.
3. Goal-oriented
Ensure your KPIs are realistic and goal-oriented. Don’t let your strategic targets be too high to achieve. Setting unachievable targets can also demotivate your employees.
4. Timely Analysis
Perform a timely analysis of your KPIs to ensure your efforts bear fruits. It is important to evaluate their impact and make the required changes.
5. Data Collection Patterns
Determine how you will collect and analyze data. Choose a data collection frequency and an aggregate method for its analysis. Define your preferred data reporting formats.
6. Mix of KPIs
A good KPI should be a mix of both quantitative and qualitative measures to gain comprehensive information on your strategic targets.
What are the 5 Elements of KPIs?
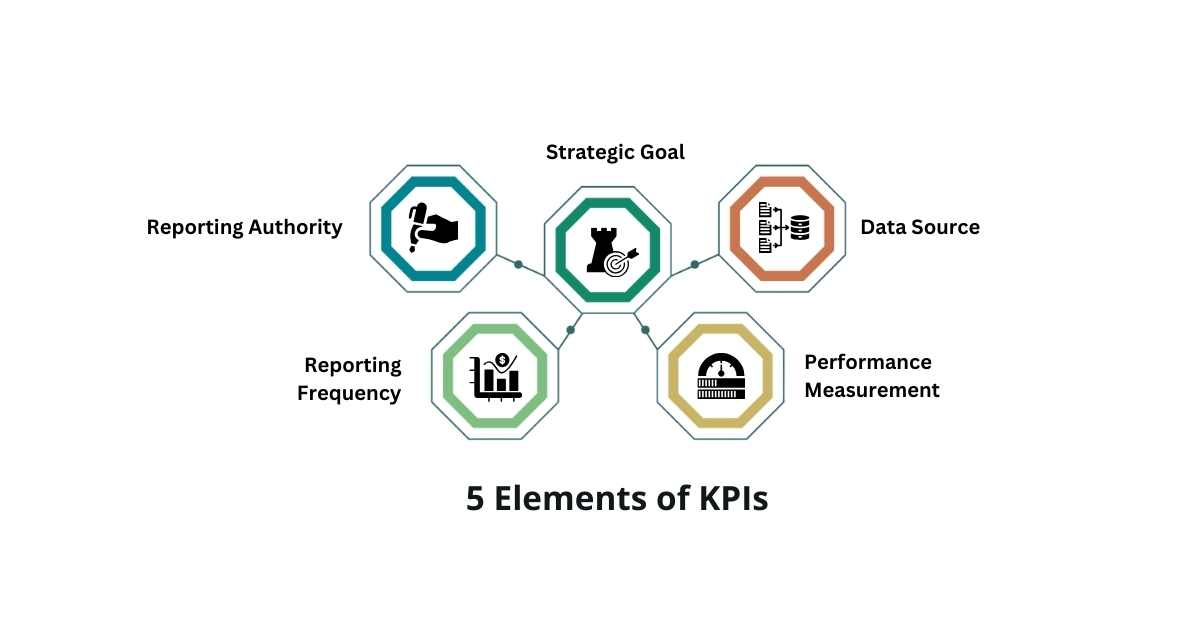
1. Strategic Goal
Every KPI should be goal-based. It should have a clear strategic vision or objective to accomplish over a select timeframe. For example, standardizing food recipes for consistent taste & quality using an ERP for Food Industry.
2. Data Source
It’s important to define how data is derived into a KPI. The data should be complete and accurate. Data consolidation becomes easier with Business Management Software.
3. Performance Measurement
The success of the organizational goals can be either measured in specific or expressive measures, depending on a case-to-case basis.
4. Reporting Frequency
Define how your data will be reported – whether monthly, quarterly, half-yearly, or annually. You can remotely access your data with a Cloud ERP.
5. Reporting Authority
A clearly defined reporting authority whose job is to periodically report the performance with predefined KPIs.
Benefits of Using a Key Performance Indicator (KPI)
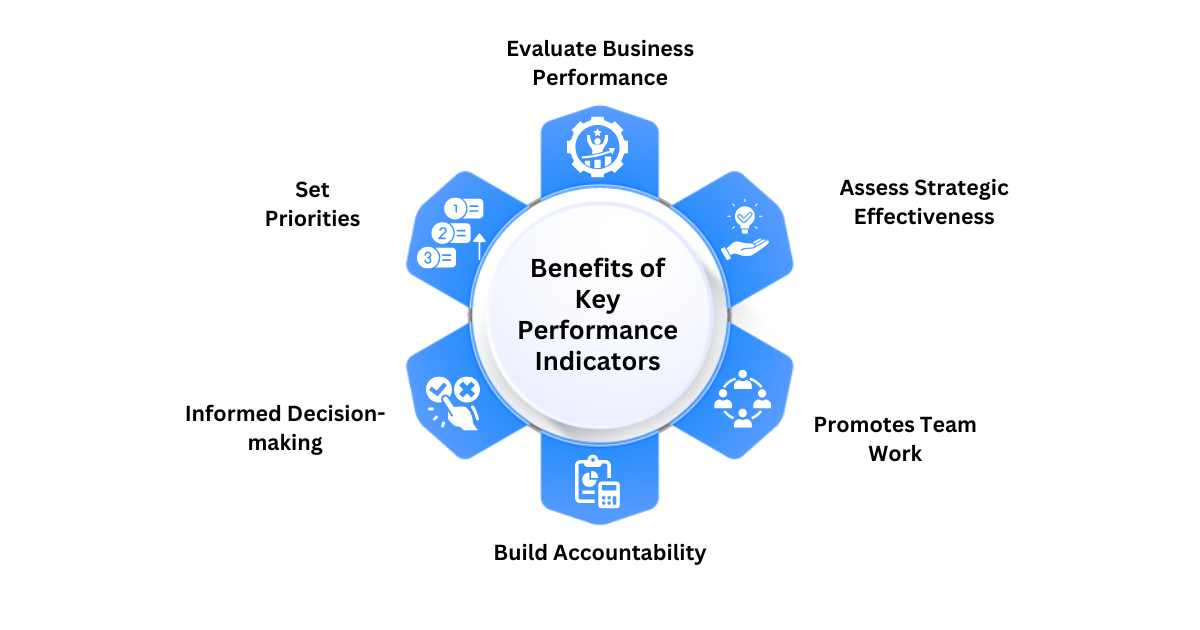
1. Evaluate Business Performance
KPIs allow you to measure your organizational performance, and determine how well your organization has been performing. If your organization is struggling to achieve its intended objectives, you can take strategic measures and fine-tune your strategies.
2. Assess Strategy Effectiveness
With KPIs, you gain visibility into your organization’s process and identify the effectiveness of various strategies. Accordingly, you can determine which strategy has been more effective and which strategies require tweaking to achieve your desired targets.
3. Promotes Team Work
As we’ve seen in the Key Performance Indicator meaning, it allows your team members to understand their targets and achieve them. Clearly communicating the expectations will allow your team members to work in the same direction and reduce the possibility of underperformance.
4. Build Accountability
With clearly defined targets & benchmarks and ERP implementation, it will become easier to evaluate the performance and efficiency of your employees and take strategic measures to improve their operational efficiency.
5. Informed Decision-making
With KPIs and Business Intelligence Tools in hand, decision-makers can deploy multiple strategies to achieve their sales and revenue targets and identify the effectiveness of each strategy. Accordingly, they can select the right strategy to maximize revenue stream.
6. Sets Priorities
KPIs establish a common framework for measuring performance. As we’ve seen in the what is Key Performance Indicator section, it ensures everyone on the team is aligned towards a common goal and understands the key aspects.
Limitations of Key Performance Indicator (KPI)
1. Changes in Business Strategies
KPIs are set after thoroughly defining business strategies. These strategies may change over time, making your KPIs obsolete.
2. Unrealistic Targets
Setting unrealistic and unachievable targets can diminish the quality of the KPIs and lead to unhelpful KPIs.
3. Data Saturation
Your business data may be too vast and fragmented across different departments. Achieving the intended objectives of KPIs can become difficult without deploying an ERP Application.
4. Lack of Accuracy
The results of the KPIs are highly dependent on the quality of your data. If the data is incomplete, obsolete, or incorrect, the KPIs may lead to incorrect results.
Difference Between KPIs and Metrics
| Key Performance Indicators (KPIs) | Metrics | |
| Concept | A simple Key Performance Indicator meaning is that it is a quantifiable measure that lets you track the progress of your company in the long term. | Metrics are quantitative measures that let you assess the progress of a process or activity within the organization. |
| Scope | Measures the performance of strategic goals & targets | Typically limited to data analysis for smart decision-making |
| Target | Achieving high-level strategic objectives | Achieving Operational objectives |
| Tracking Period | Quarterly, annually | Daily, weekly |
| Common Examples |
|
|
| Relevancy to Company’s Success | Directly linked to the company’s success & growth | May or may not be directly linked to the company’s success & growth |
Difference Between Leading & Lagging KPIs
| Leading KPIs | Lagging KPIs | |
| Definition | Leading KPIs are the indicators that predict future events or occurrences | Lagging KPIs are the indicators that facilitate analysis of past events |
| Goal | Helps fine-tune your strategies to meet predefined targets | Ascertain whether the predefined targets have been met |
| Focus | Futuristic | Historical |
| Risk Identification & Mitigation | Identify potential risks | Identify historical risks |
| Measurement Frequency | Daily or weekl | Quarterly or Monthly |
| Changeability | Can be changed | Can’t be changed |
| Example KPIs |
|
|
Wrap Up
KPIs are important business metrics that allow decision-makers to evaluate business performance and fine-tune their strategy to meet actionable goals. The usefulness of KPIs may vary across different industries. Some businesses may prefer certain KPIs over others.
Sage X3 is a top-notch solution that comes with a host of KPIs that allow you to understand the effectiveness of your goals & targets. It can be helpful to understand the effectiveness of your production, marketing, sales, customer support, and financial activities.
FAQs
1. What is the Simple Definition of Key Performance Indicator (KPI)?
A simple definition of Key Performance Indicator is that it is an important business indicator that allows you to measure the success, efficiency, or performance of your strategic goals and targets. KPIs can be both quantitative or qualitative depending on the business’s requirements.
2. What is KPI Full Form?
Now, let us discuss what is KPI full form. The KPI full form is the Key Performance Indicator which is a critical quantifiable metric that tracks and indicates the progress toward achieving a strategic business goal. It provides a degree of tracking, tracking efficiency, and measuring success.
3. How to Define Performance Indicators in Layman’s Terms?
We can define Performance Indicators in layman’s terms as different business indicators that allow you to monitor progress against a set of targets or objectives.
4. Which KPIs are Most Commonly Used by Businesses?
The usefulness of a KPI may vary from company to company and industry to industry. Different companies may use different KPIs to meet their unique requirements and meet strategic targets. However, some of the most commonly used KPIs include Customer Satisfaction, Customer Retention Rate, Revenue Per Client, Profit Margin, and Revenue Growth.
5. What is a KPI Dashboard?
KPI Dashboard is a user interface that converts large & complex data into easy and intuitive charts & reports. It provides the following information:
-
-
- Measure the progress or success of your targets
- Get a comprehensive analysis of your strategic targets
- Track the efficiency and effectiveness of your campaigns
- Provide a degree of comparison between two or more parameters
- Easily find behavioral patterns, and make faster, informed & data-driven decisions
-
6. Why are KPIs So Important?
Modern-day businesses increasingly rely on KPIs due to the immense potential they offer:
-
-
- Allow shareholders to evaluate the business performance and reinforce trust through data-driven research
- Identify areas of inefficiencies and poor performance, and fine-tune business strategies accordingly
- Keep teams focused on common objectives and strategic business goals
- Grab potential opportunities to improve revenue stream and capture new markets
- Identify potential risks, and analyze & reduce their impact on the business
-
7. How to Ensure Your KPIs are Aligned with Strategic Business Goals?
There are several ways to ensure your KPIs are aligned with your strategic business goals:
-
-
- Clearly define your business goals and make sure that your KPIs align with them
- Make sure your KPIs are realistic and measurable
- Set a specific timeframe to achieve your goals
- Clearly communicate your KPIs with your team members
- Regularly review your KPIs from time to time
- Optimize your KPIs to meet your evolving market requirements
-