What is Break Even Analysis?
Break Even Analysis is a risk evaluation method of determining the level of output at which the cost of the production will be equal to the revenue generated from sales to cover fixed & variable costs, and make the business profitable.
Break Even Analysis is often used in different contexts. For example, businesses use it to set sales targets through Profit-Volume charting. Stock market traders use it to determine the level at which they can recover the original value of their underlying asset and avoid losses. Homeowners use it to offset their net purchase price (which includes maintenance charges, and interest on mortgages) while selling their homes.
What are the Components of Break Even Point Analysis?
Now that we’ve discussed the Break Even Analysis meaning, let us discuss its components.
1. Fixed Costs
Fixed Costs are also called Overhead Costs. These costs remain constant, regardless of the changes in the volume of production. In simple words, businesses have to bear fixed costs even if the production drops to zero. Examples of fixed costs include energy costs, machinery costs, rent of premises, mortgages, insurance premiums, and taxes payable to the Government.
2. Variable Costs
Unlike Fixed Costs, Variable Costs are fluctuating in nature. They increase or decrease the per the volume of production. Examples of variable cost includes raw material costs, fuel costs, product packaging expenditures, and the cost of procuring production materials. Differentiating variable costs from fixed costs is important for businesses for better decision-making.
3. Selling Price
Selling Price is the amount that the company charges for its products and services. Setting the right selling price is a complex yet crucial process. In today’s highly competitive business environment, businesses are leveraging BI tools to uncover new trends & patterns, analyze customer behaviors, and build successful marketing campaigns.
4. Contribution Margin
Contribution Margin is an integral component of the Break Even Analysis that denotes how much revenue is required to be generated to cover fixed costs and contribute to business profits. It is calculated by subtracting variable costs from the selling price. For example, if the price of a television is Rs. 40,000 and the variable cost (i.e. cost of raw materials, labor, etc.) is Rs. 15,000, the contribution margin is Rs. 25,000.
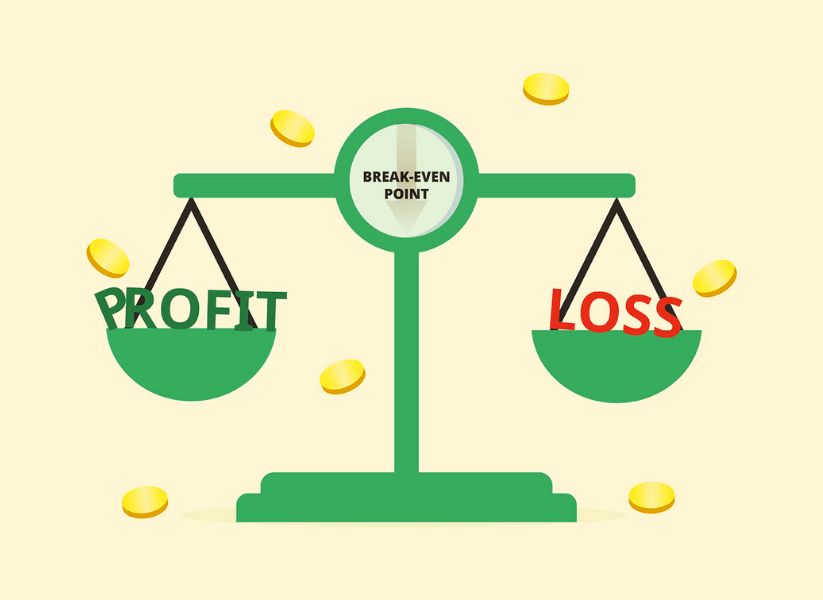
5. Break Even Point
The Break Even Point is the level of production at which the production cost equals the revenue generated from the sale. In other words, it is a “No Profit – No Loss” point wherein the business neither gains profits nor losses. Break Even Point analysis helps businesses identify the Break Even Point to set marketing targets, optimize product pricing, and uncover hidden expenditures.
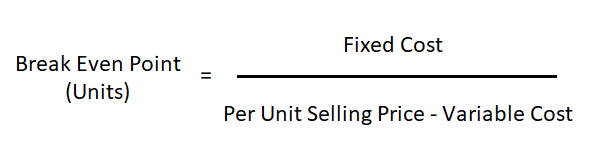
Break Even Analysis Formula
Now that we’ve covered the Break Even Analysis explanation, let us move to the Break Even Analysis formula.
Break Even Analysis Formula:
Break Even Point Analysis Example
Let us take a simple Break Even Point Analysis example of a small company involved in the manufacturing of smartwatches. The company incurs a Fixed Cost of Rs. 500,000, a Variable Cost of Rs. 400/ unit, and sells the same smartwatch in the market for Rs. 2,500.
Now, we shall calculate the Break Even Point as per our above Break Even Analysis formula.
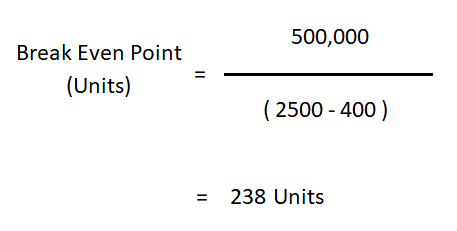
As per our Break Even Point Analysis example, the smartwatch manufacturing company will need to sell at least 238 units of smartwatches to attain the Break Even Point (i.e. No Profit – No Loss Position). If the company manages to sell additional units of products, it will start gaining actual profits.
Break Even Point Analysis Graph
Now, let us try to illustrate our example with an illustrative Break Even Point Analysis graph.
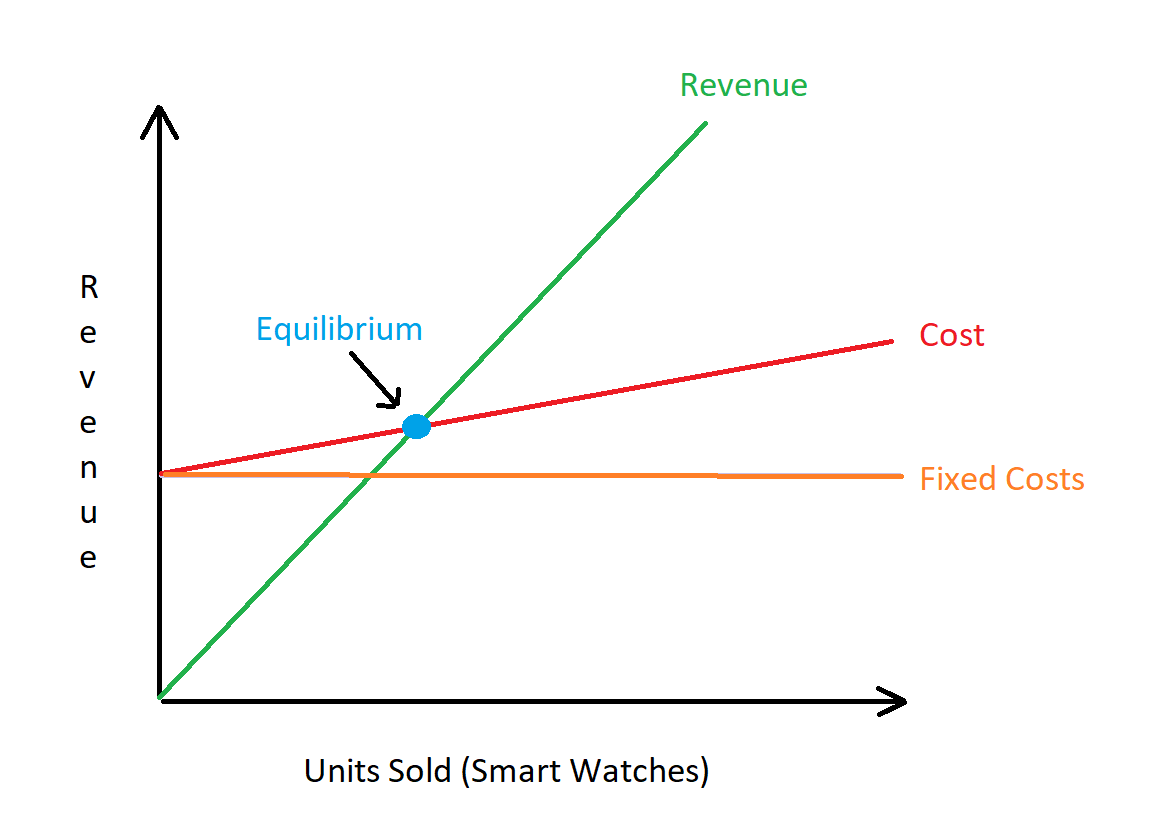
In our above Break Even Point Analysis graph, there are two axes namely the X-axis and Y-axis. While the former denotes the units of smartwatches sold, the latter denotes revenue generated from the sales.
The Fixed Costs Line depicted in the orange color indicates the fixed (overhead) costs incurred by the company. The Cost line in red color indicates the Total Cost incurred for producing the smartwatches. The green-colored Revenue Line indicates the revenue generated from the sale of the smartwatches. The intersection point of both the Cost and Revenue lines is the equilibrium point (i.e. No Profit – No Loss).
At this point, the company has uncovered all the manufacturing expenses, yet it neither generates profits nor incurs losses. As the company manages to make additional sales beyond the intersection point, it starts generating actual revenue from those additional units sold.
Common Use Cases of Break Even Point and Break Even Analysis
Break Even Point and Break Even Analysis are used in different scenarios given below:
1. Starting a New Venture
Are you starting a new venture? If so, a thorough planning of Break Even Point and Break Even Analysis is a must if you want to succeed in your business. Break Even Analysis will help you estimate costs for running your venture (both fixed and variable costs), understand different profitability scenarios, and mitigate risks. In the long run, your business will remain viable, effectively deal with demand fluctuations, and stay profitable.
2. Launching a New Product
Launching a new product has never been easier. The production and marketing of a new product incur a significant cost. Break Even Point and Break Even Analysis aids the sales management process. It allows businesses to optimize the pricing strategies for their new products even before they are launched. Ultimately, the business benefits from accurate demand forecasting and higher sales revenues.
3. Business Process Restructuring
As your business expands in size and operations, it requires restructuring its internal processes and adopting new revenue models. For example, you started your business as a retailer. After running a successful business for years, you may wish to switch to wholesale operations. You will need to perform Break Even Point and Break Even Analysis to ensure you understand & mitigate risks, and form better strategies for continuing your success journey.
4. Financial Budget
Much like the Government, businesses make plans about how they will secure funding and spend a portion of it on various activities from manufacturing, R&D, quality checks, office administration, marketing, and customer support, to administration. Budgeting requires thorough planning and tracking of expenditures & revenues. Break Even Point and Break Even Analysis help businesses plan their sales targets to uncover the cost of production, and effectively allocate money, assets, and human resources to accomplish them.
5. Business Expansion
As your business expands in size and operations, you will want to make changes to the internal processes and transform them to support growing operational needs. Break Even Point and Break Even Analysis play an important role in business expansionism. Conducting a thorough Break Even Analysis is vital to making data-driven & informed decisions, developing organizational goals, and tailoring the marketing strategies to generate revenue streams.
What are the Benefits of Break Even Analysis?
Why should businesses invest their time and efforts in calculating Break Even Point and Break Even Analysis? Here are some popular reasons:
1. Optimize Product Pricing
One of the major benefits of Break Even Analysis is that it helps businesses adopt better pricing models. By studying the Break Even Point Analysis graph, decision-makers can set better pricing models that not only uncover costs but also widen profit margin. Such thoroughly pre-planned pricing strategies play an important role in ensuring the business is less prone to fluctuations in market demand.
2. Unveil Cost Structure
Break Even Analysis provides deeper insights into the company’s cost structure through Cost Breakdown Analysis. It provides companies a better control over fixed and variable costs. For example, it makes it easier to identify and control discretionary expenditures which helps optimize the Break Even Point. Such cost-control measures benefit the organization in the long term with better debt management, and a high credit rating, and ensure costs do not get out of control.
3. Mitigate Potential Risks
Other benefits of Break Even Analysis include identifying and mitigating potential business risks. This includes a range of activities such as tracking the price sensitivity of the product and tracking how sensitive it is to external factors. By identifying such factors, the company is better positioned to develop disaster recovery plans to fight market uncertainties such as sudden drops in the sales of the protrude.
4. Better Sales Targets
Break Even Point and Break Even Analysis add clarity to the marketing activities of the company. As we’ve already covered in the Break Even Analysis definition, it enables decision-makers to understand how many units of the product need to be sold in order to cover the total costs, and gain profits. Such insights serve as a foundation for marketing efforts. Marketing and sales employees gain clarity in the entire process and it improves their morale.
5. Higher Profitability
Last but not least, the benefits of Break Even Analysis also include increased profitability. As decision-makers gain a complete understanding of the company’s cost structure, they can explore new cost-saving opportunities, innovations, and methods to lower the cost. For example, a company can switch from an office space to outsourcing. Adopting such innovative ideas can directly translate into higher profitability.
What are the Limitations of Break Even Analysis?
While Break Even Analysis is a useful measure to make informed decisions, it has its own limitations. Here are some of its key limitations:
1. Highly Data Dependent
Break Even Point and Break Even Analysis are highly data-dependent. This means that its performance and outcomes are influenced by the specific dataset given by the user. Sometimes, businesses may not have access to accurate and complete information. In such scenarios, relying on the Break Even Point and Break Even Analysis may lead to inaccuracies in product pricing, marketing, and higher decision-making.
2. Impact of External Factors
In today’s time, businesses operate in a highly competitive business environment. As such, several external factors such as new competitors, new market trends, and changes in customer’s buying patterns, affect their sales and profitability scenarios. Break Even Point and Break Even Analysis do not take such crucial external factors into consideration and assume that these factors remain consistent. As a result, its usefulness is limited only till the external factors remain the same.
3. Inconsistent Material Costs
The cost of raw materials may not remain consistent and keep changing from time to time. When the cost of the raw materials increases or decreases, the Break Even Point and Break Even Analysis may change. The previously forecasted outcomes may no longer be relevant and reliable for decision-making in real-world scenarios.
4. Changes in Selling Price
Break Even Point and Break Even Analysis assume that the selling price of the product remains consistent all the time. However, in a real-world scenario, the selling price of the product may change at any time due to external factors such as demand for the product, elasticity of demand, availability of substitutes, festivals, and so on.
5. Single Product Model
Break Even Point and Break Even Analysis assume that the company sells only a single product. It is typically incompatible with companies that sell multiple products. In real-world scenarios, many companies sell a wide range of products targeting different customer niches. In such cases, the usefulness of the Break Even Analysis may be limited to smaller companies that sell only a single product.
Proven Strategies to Optimize Break Even Point
Is your Break Even Point too wide and difficult to achieve? If so, here are some proven strategies that may help you bring it closer.
1. Cost Control Measures
One of the first strategies to lower the Break Even Point is to lower your operating costs. Your business can reduce them by adopting modern technological solutions and automation. You could also outsource non-core functions, and take advantage of the Internet to sell your products rather than opening a fully-fledged retail store.
2. Modern Technological Solutions
Enterprise Resource Planning is a must-have solution for modern manufacturing businesses. It contains a comprehensive set of modules that consolidate data from different business functions, and help decision-makers with timely & accurate forecasting and powerful analytical capabilities. ERP implementation allows decision-makers to leverage modern technology to reduce costs, streamline processes, increase efficiency, and support business growth.
3. Higher Pricing Strategy
As you increase the price of your products, you will reduce the time and the number of sales required to reach the break-even point. You won’t need to sell as many units of products as you initially intended to do. However, in a real-world business scenario, the pricing models are complex in nature. Businesses operate under the pressure of competitor’s pricing strategies. Increasing the product price may lead to losing the existing market share to competitors. Moreover, customers may expect superior quality of product and customer service.
4. Lean Manufacturing Principles
The concept of Lean Manufacturing focuses on reducing manufacturing waste, lowering the variable cost, and increasing the production efficiency & turnaround times. In the context of lean manufacturing, the word ‘waste’ signifies anything that doesn’t provide value to the final consumer of the product. Adhering to lean manufacturing principles results in process optimization, reduced manufacturing time, and minimized manufacturing costs.
5. Restructure Revenue Models
Businesses that sell low-profit margin and high-cost products often take longer to achieve the Break Even Point than businesses that sell high-profit margin and low-cost products. Restructuring the internal business strategies and focusing on the sale of high-profit margin and low-cost products can play a critical role in optimizing the Break Even Point. Be mindful that this may require a significant internal restructuring in the manufacturing, quality assessment & revenue model, and comes with other added risks.
Concluding Thoughts
Adopting ERP Software one of the fundamental changes your business can make to lower the break even point and devise smarter pricing, marketing, and operational strategies. It offers powerful data analysis features that help decision-makers identify trends, patterns & anomalies, and get a thorough grasp of the market conditions & consumer buying patterns.
With Sage X3, your business benefits from a diverse set of industry-specific modules that help decision-makers unveil new opportunities, meet revenue targets, and achieve unprecedented growth. It brings a free flow of information across all the core business processes and unfolds actionable insights for decision-makers to make informed decisions and become agile to ever-changing business needs.
FAQs
1. What is the Break Even Analysis Definition?
Break Even Analysis meaning is that it is a process that involves identifying the number of units to be sold to cover the total cost of the production, and maximize business profits. It is a widely used economic concept that works as the foundation for many of the company’s decisions pertaining to production, marketing, and sales.
2. What is the Difference Between Break Even Point and Break Even Analysis?
Both Break Even Point and Break Even Analysis are interlinked concepts. Break Even Point is considered as a measure of the margin of security which denotes a specific figure. As per our Break Even Analysis explanation, Break Even Analysis is a process of calculating the volume of sales a business must generate in order to cover its manufacturing cost and enter into the profit zone.
3. What are the External Factors that Can Impact the Break Even Point?
There are several factors that can impact the Break Even Point. These include fluctuations in the demand for the product, availability of substitutes, introduction of new competitors, change in inflation, and introduction of disruptive technology (such as Artificial Intelligence). External factors can
4. What is the Difference Between Fixed & Variable Costs?
In simple words, fixed costs refer to the cost of production that remains consistent and doesn’t change with an increase or decrease in the volume of sales. In contrast, variable costs are volume-dependent. They keep changing in relation to the sales volume. Examples of fixed costs include rent of factory premises, property taxes, employee salaries, etc. Examples of variable costs include raw material costs, commissions paid to sales agents, labor costs, etc.
5. What is the Margin of Safety?
The Margin of Safety in the Break Even Analysis is the difference between the potential profits expected from the sale of the company’s products & services and the break even point. The higher the Margin of Safety, the better the business performance, and vice versa. A business with a wide buffer Margin of Safety is typically considered immune to volatility in the sale of its products & services.