The Benefits of Sage Business Intelligence
Get started right away, with the ready-to-use reports that have already been formatted for you. To run a report, select the information you wish to report on is all that is required.
Data Visualization and report download to Excel.
You may see your data online or export your report to Excel to perform additional modification when using the cloud solution that Sage Intelligence provides.
Use Excel to do the analysis of your data that you desire.
Sage Intelligence gives you the option to examine your data in Excel since we know how popular it is and you can make the most of its graphs, charts, and slicers to easily understand what’s going on in your business.
Easily edit current reports or build new ones.
Looking for a certain report? You have complete control over the appearance and feel of your report, whether you edit an already-existing Sage Intelligence report or write one from new.
Starting with Report Manager:
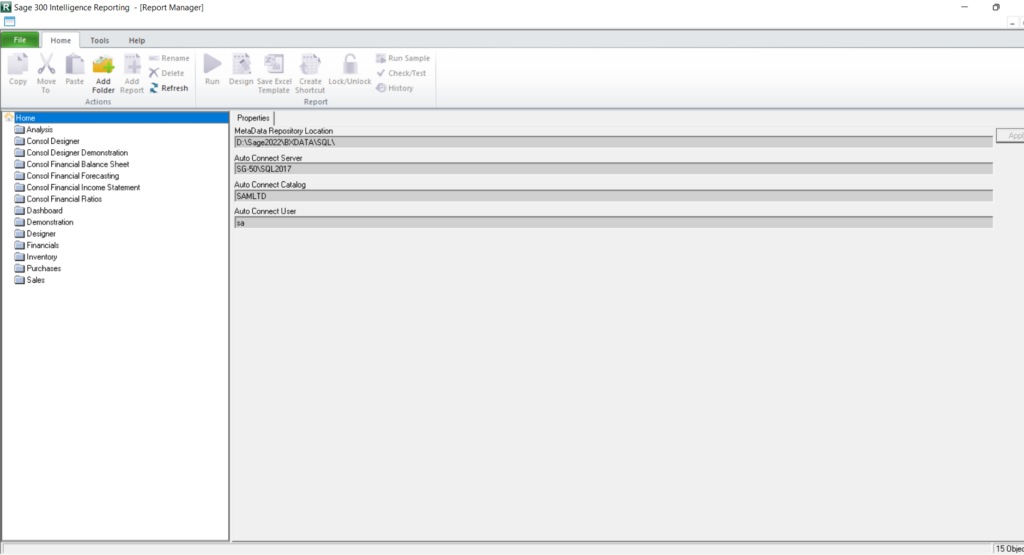
The Report Manager provides an interface to create and modify reports. Reports can be grouped into folders, and properties of reports can be reviewed and edited as necessary. The Report Viewer provides an interface to run the reports directly. You, can also view reports from Report Manger. Easily customize existing reports or create new ones using Report Manager screen.
In Sage 300 navigate to Intelligence Reporting -> Report Manger
Below is the image for your reference. From Report Manager screen user can manger all the Intelligence report according to the requirement.
Now, we will have a look into the Report Viewer.
From report viewer user can print various type of report starting from purchase, sales, customer, vendor to inventory in modernize version of all reports in Excel format.
To view the reports firstly, navigate to Intelligence Reporting -> Report Viewer screen.
Below is the image for your reference.
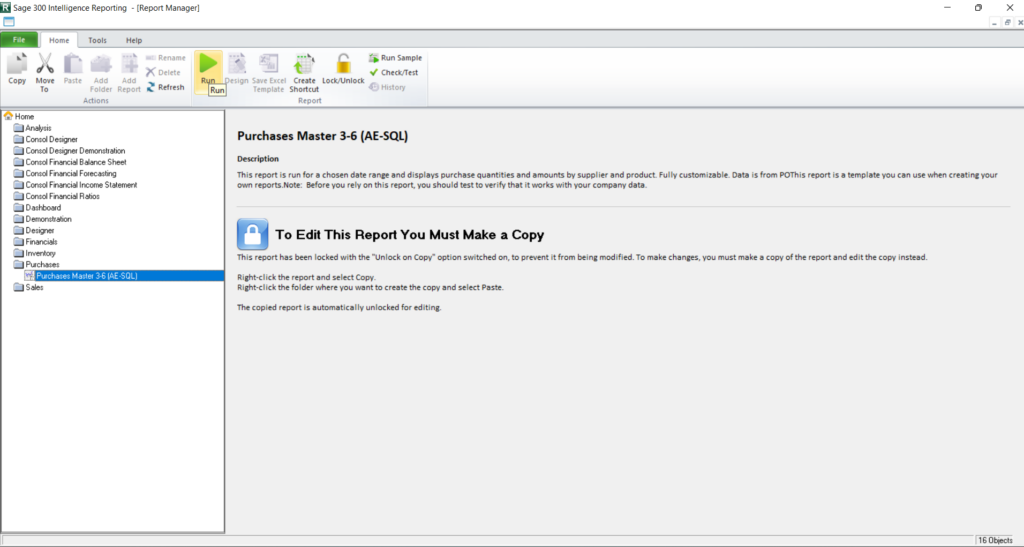
To run any report just click on the sub-menu and then click on “Run” button to run the report. Also, user can read the description of the particular report when you select the report to get the exact idea about the report what all it will show you in excel format file.
Here, we will run the Purchase master report.
Below is the image for your reference.
After clicking on “Run” button you will get a prompt for select for date criteria. Select the ‘Start Date’ and ‘End Date’ to get report print for that particular period. Below is the image for your reference.
Also, in ‘CURRENCY’ select the currency type which you want in the report.
Below is the image for your reference.
After selecting the currency click on the ‘OK’ button to get the report printed.
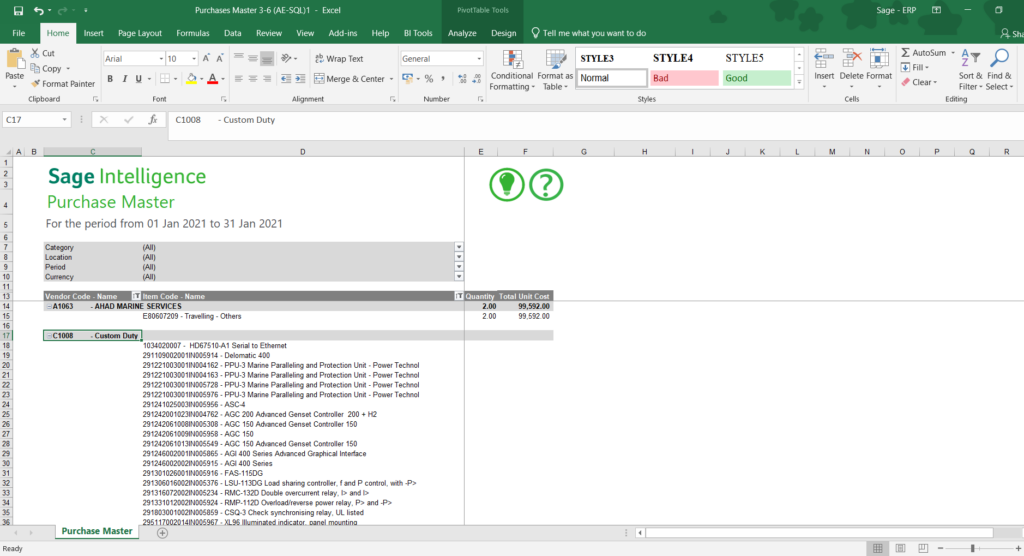
After clicking on ‘OK’ button system will run some processes to get the report generated, after that you will be able to see the excel format of Purchase master report with clean and user-friendly look.
Below is the image for your reference.
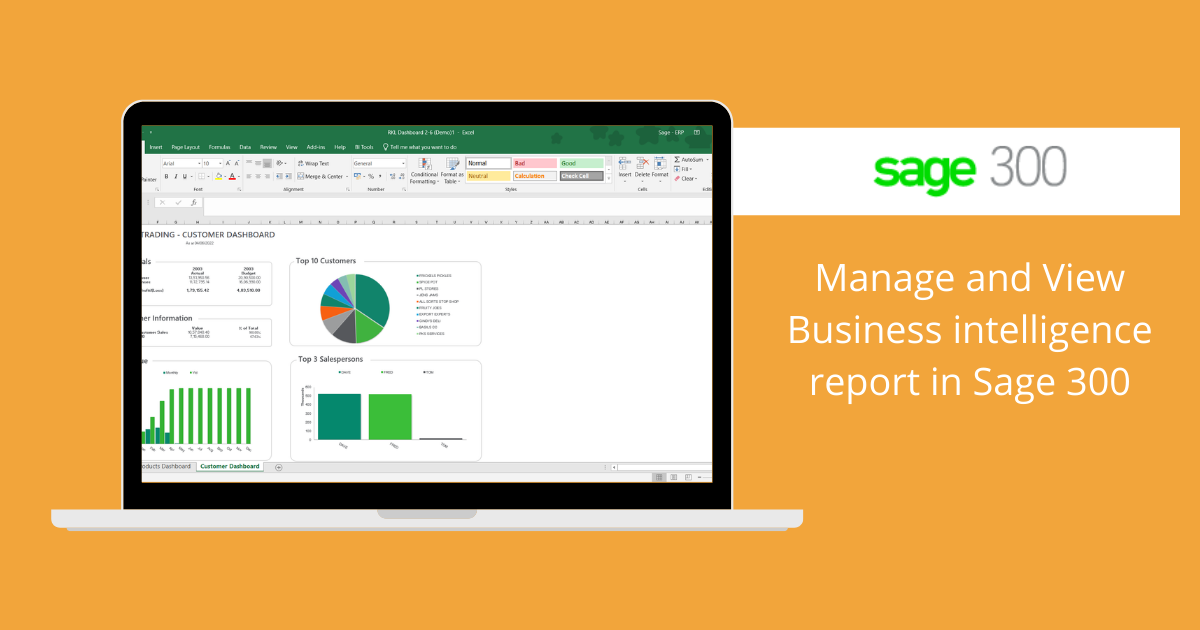
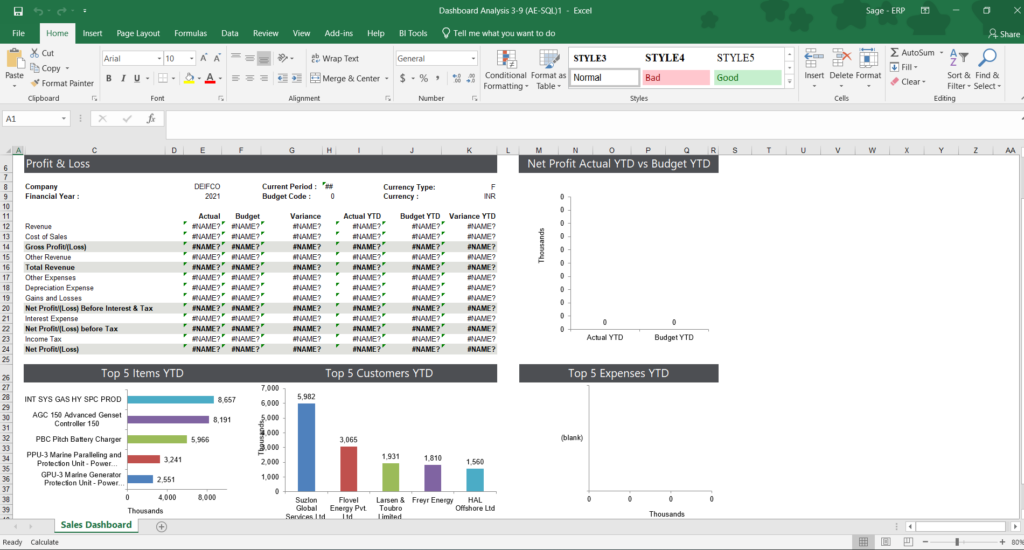
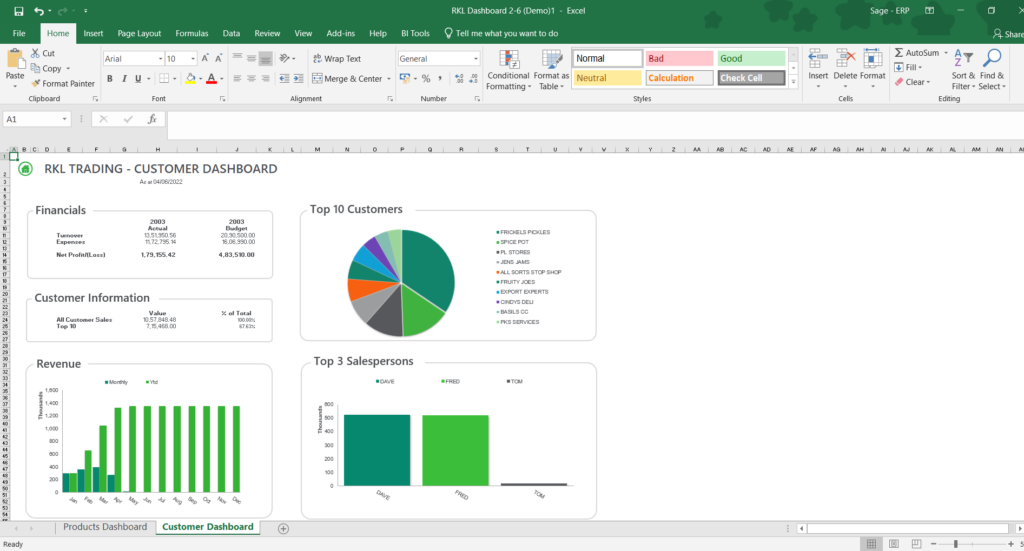
Also, you can run dashboard and pie chart reports.
Below are some example of reports.
Similar, to this report there are plenty of standard reports in Report Viewer which can run with minimal configurations and provide you real time critical information and summary of various verticals of your business.
